The Gross Domestic Product (GDP) per capita is considered to be the most common form of presentation of spatial income disparities between countries and regions. For the Visegrad countries, a good benchmark is the average GDP per capita, in the EU.
Piotr Rosik, Patryk Duma
At the time of their accession to the European Union in 2004, the Visegrad countries were much less developed than the rest of the EU. The richest Czechia in terms of nominal GDP per capita reached only 44% of the EU average. There were also much greater income differences between the Visegrad countries than today. Poland, which was weakest in this respect, achieved only 25% of the EU average. Taking into account the purchasing power of the population (GDP of the PPP), all Visegrad countries achieved higher GDP per capita than nominal GDP due to the relatively lower price level in our part of Europe in relation to the rest of the EU. In 2004, it was 80% of the EU average in Czechia, 63% in Hungary, 59% in Slovakia and 52% in Poland (Fig. 1).
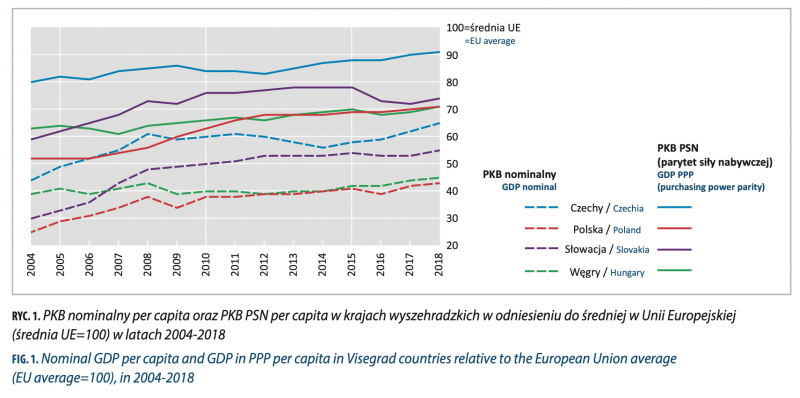
In the years 2004-2008 (the period before the finan- cial crisis), the Visegrad countries developed faster than the rest of the European Union. During this period, however, the fastest growth was observed in Poland, which signif- icantly reduced the difference in GDP per capita between it and Hungary. In 2009, there was a one-year fall in nominal GDP per capita in Visegrad countries compared with the EU average, with the exception of Slovakia, which became part of the euro area in 2009 and, unlike Czechia, Poland and Hungary, its currency could not lose value against the euro during the financial crisis. The situation was different in terms of GDP per capita of the PPP compared to the EU average, where Slovakia was, in turn, the only country to have seen a fall in the value of the indicator, which was mainly due to the large share of the automotive sector, which was sorely affected by the crisis, in Slovakia's GDP.
After 2009, the increase in nominal GDP per capita in Visegrad countries relative to the average was not as spectacular as before the crisis. In Czechia in particular, the situation has even deteriorated until 2014. At the same time, Slovakia has seen very rapid growth in nominal terms. Relatively poorer Poland and Hungary also developed at a similar pace (both in terms of nominal GDP and GDP in PPP) Taking into account the purchasing power of the population, the values of GDP per capita in Slovakia came close to those in Hungary and Poland.
In summary, the post-accession period proved to be a great success in all V4 countries. These countries re- corded spectacular increases in GDP per capita relative to the EU average, both in nominal terms and in purchas- ing power. In the latter case (GDP of the PPP) Czechia in 2018 was already at 91% of the EU average, Slovakia at 74% and Poland and Hungary at 71%. If this growth rate is maintained around 2030 Czechia will be equal to the EU average, and the other countries will be in the range of 80-90% of the EU average. In nominal terms, however, although in percentage terms the growth rate here is higher than the GDP of the PPP, it will certainly take several decades to reach the EU average, due to the very low base effect in 2004. It is worth noting that at present (November 2020) it is not known how deep the recession caused by the coronavirus epidemic (pandemic) in Europe will be, including the countries that will be affected the most and the least. As the estimated changes for some countries may even be two-digit, this may affect the level of differences between the Visegrad countries and “old” Europe.
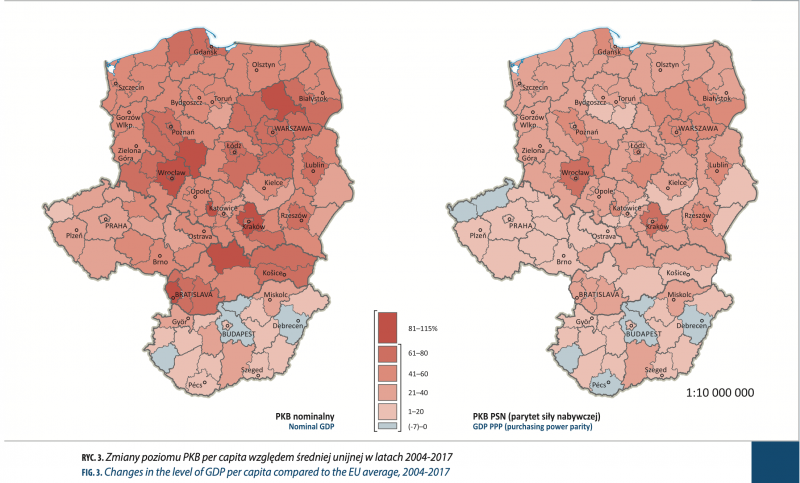
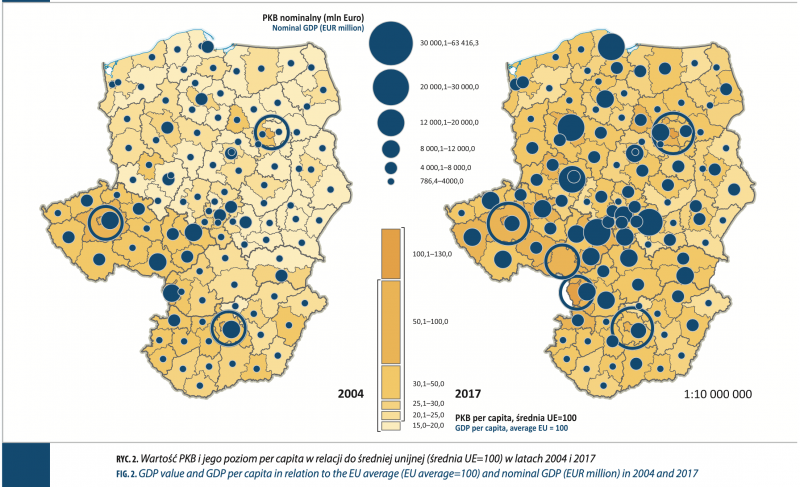
In spatial terms, the highest GDP per capita values are characterised by the capitals of Visegrad countries and a large number of regions in the relatively richer Czechia, as well as the western borderland of Slovakia and Hungary, and selected sub-regions of high industrial importance in Poland (location of seats of large companies from the mining or fuel sector). Globally, the GDP is also strongly concentrated in the capital regions and in Katowice conurbation. The poorest regions are Eastern Poland, Central Pomerania and selected peripheral regions of Hungary (Fig. 2).
Changes in the GDP of subregions in percentage terms are a mostly consequence of GDP dynamics at the national level. The fastest growth in nominal terms was observed in Poland and Slovakia, with both countries being quite spatially differentiated. The most rapid development in Poland was in the Wrocław and Kraków sub-regions (the suburbs around fast-growing cities gaining from the process of suburbanisation and reloca- tion of enterprises to industrial zones near Wrocław and Kraków). The most rapid development in Slovakia was in the Żyliński kraj and Bratislava. In Czechia and Hungary, there are sub-regions which have lost out in relation to the EU average in the analysed period 2004-2017, while in Hungary, such a trend is also visible when considering nominal GDP. It is interesting that in Czechia, the least developing regions are those located on the border with Germany, with the highest European accessibility from the entire Visegrad area, i.e. Karlovarský kraj and Ústecký kraj, and in Hungary, the region surrounding Budapest, i.e. Pest region (komitat), is underdeveloping (Fig. 3).