
COVID-19 was first diagnosed in Wuhan in central China in December 2019. It is caused by the coronavirus SARS-CoV-2 acute respiratory disease. The disease also reached Europe in a short time, and the situation is changing rapidly.
Tomasz Michalski, Wioletta Szymańska
At the outset, it should be noted that the official picture of the spread of the COVID-19 pandemic in society is influenced by the number of tests performed. Until September 12, 2020, the most intensive testing process was carried out in Czechia (98 tests per 1000 population), then in Poland (78) and Slovakia (70), and the least intensive in Hungary (55). Compared to neighbouring countries, Lithuania (252), Germany 147), Austria (148) and Romania (107 thousand) were tested more intensively. At a similarly low level (as in the EU), Slovenia (87) and Croatia (53) were tested.
Looking at the daily number of new people with diag- nosed SARS-CoV-2 per 1 million inhabitants in the period up to 12 September 2020, we can see both differences and similarities between the Visegrad Group countries (Fig. 1). First of all, at the very beginning of the pandemic (March 11-April 9 2020), the intensity of new cases was significantly higher in Czechia than in other countries. Sec- ondly, during almost the whole period of May and June, the intensity of diagnosed new cases of SARS-CoV-2 infec- tion was higher in Poland than in other countries. Thirdly, the situation in Czechia, Slovakia and Hungary started to deteriorate, starting from the third decade of July. The rate of this deterioration increased in early September and is exceptionally high in Czechia and Hungary. As the latest data from the end of September and October indicate, this period can be described as the first stage of the pandemic.
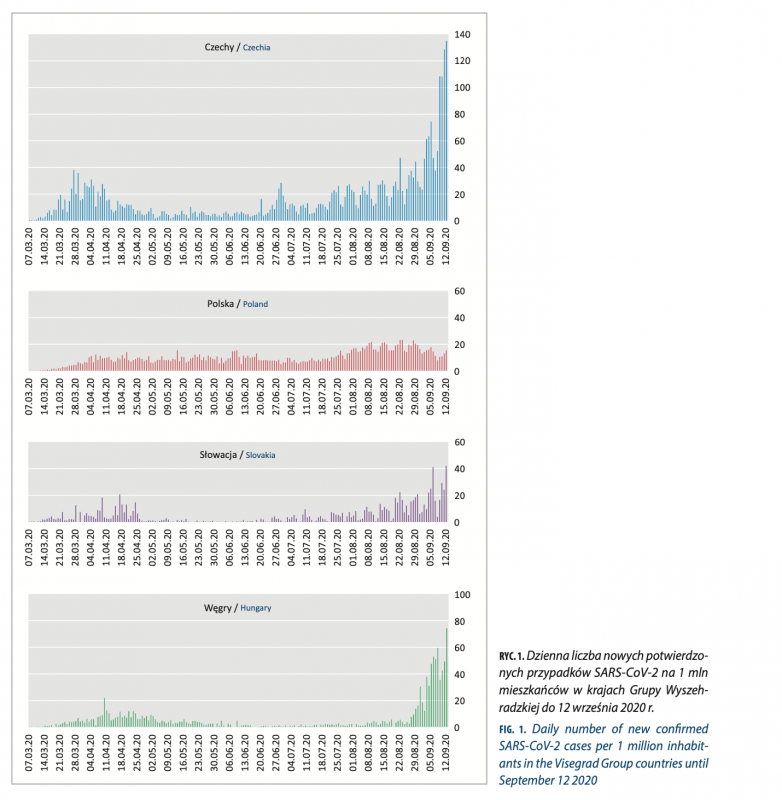
For example, in Poland, on 21 October 2020, slightly more than 10 thousand infections were detected, i.e. on one day, there were more or less as many as in the whole month of April (or May, June and July).
In turn, analyzing the total number of diagnosed cases of SARS-CoV-2 per 1 million inhabitants in the Visegrad Group countries in the period to until September 12 2020 (Fig. 2), we see that there are three trends. The worst situation is in Czechia, where the number of infected people increased relatively quickly, which then remained at a relatively high level and at the end of the analyzed period began to grow again sharply. On the opposite side we have Slovakia and Hungary, where the growth was slow and the number of infected people remained quite low for almost the whole period. It was only at the very end of the period in question that the growth was very fast.
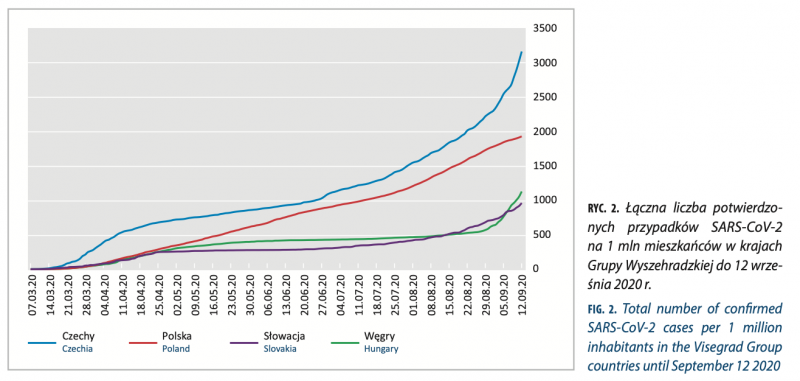
The changes in Poland can be described as indirect. At the beginning of the pandemic, the increase in the number of infected people was small, similar to that observed in Slovakia and Hungary. For the rest of the period there is a stable upward trend – so there was neither a period of slowing down the increase in the number of infected people in the middle of the period nor a sharp increase at the end of the period.
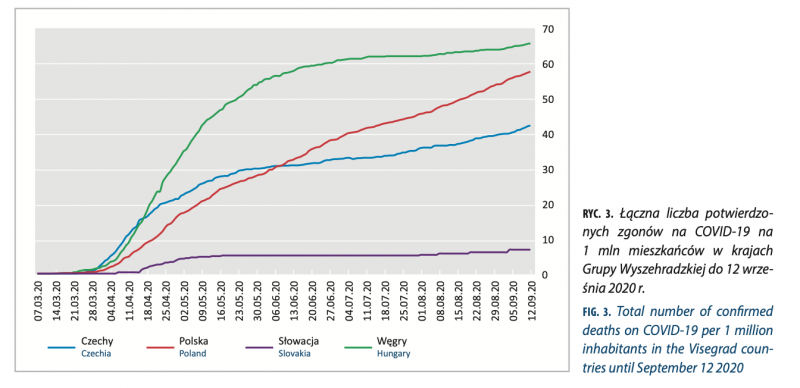
Fig. 3 shows that the COVID-19 mortality trend for the period up to 12 September 2020 in Czechia, Slova- kia and Hungary was similar, varying only in intensity. In Hungary, the number of deaths increased rapidly and stabilized at the end of May 2020. A slight increase in the number of deaths was recorded again only in the last days of the analyzed period. The situation was similar in Czechia, but the mortality rate there is, on average, about 40% lower than in Hungary. The same is true for Slovakia, but there the mortality rate is only about 1/10 of that recorded in Hungary and 1/6 of that recorded in Czechia. The situation was different in Poland, where the first death was recorded the earliest (12 March 2020). Since then, there has been a stable upward trend. On the other hand, in the autumn, with the accompanying deterioration of the weather and the previously predicted overlapping of influenza and SARS-CoV-2 infections, led to an overload of the health care system as well as an increase in the number of deaths on COVID-19.
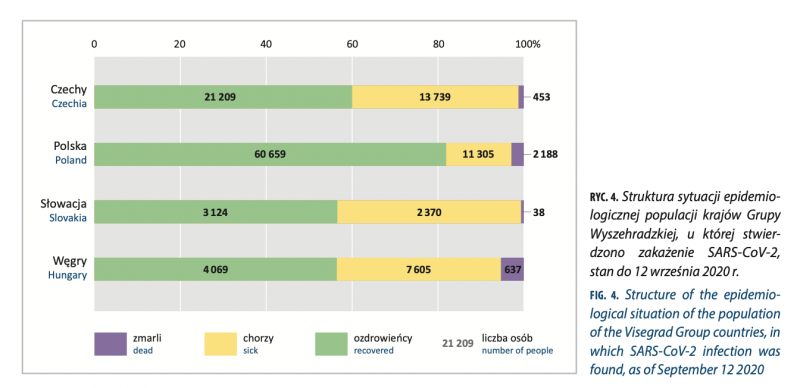
Comparison of the epidemiological situation of people with SARS-CoV-2 virus detected shows very big differences between the countries concerned. Fig. 4. shows their structure as of 12 September 2020. We can see that the best situation was in Poland, where the recoveries constituted as much as 81.8% of the people diagnosed with the infection. The worst situation was in Hungary, where the recoveries constituted only 33.1%. Similar proportions of healers were recorded in Czechia (59.9%) and Slovakia (56.5%). Similarly, taking into account the percentage of the deceased, the worst was in Hungary (5.2%), while the best was in Slovakia (0.7%) and Czechia (1.3%). The situation in Poland (3.0%) can be considered as indirect.
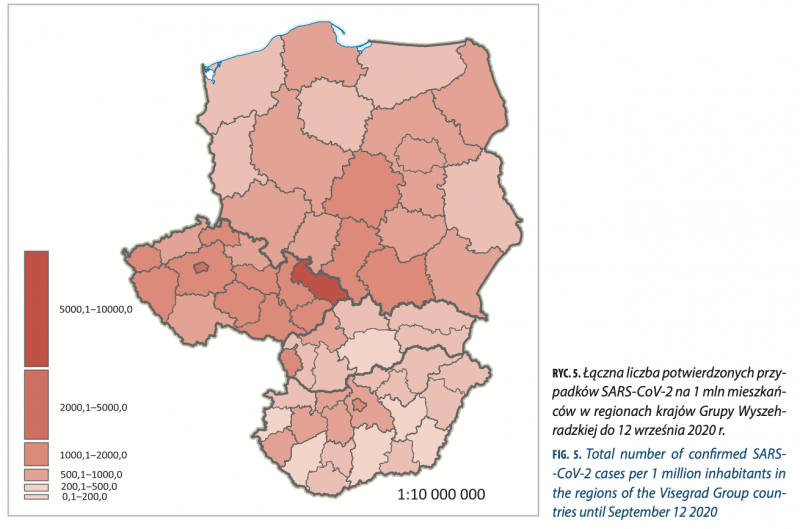
Looking at the total number of diagnosed cases of SARS-CoV-2 per 1 million inhabitants in the regional system in the period up to 12 September 2020 we can see small regularities (Fig. 5). This is illustrated, as we already know, by the period of a relatively small number of infections in V4 countries. The analysis was carried out in division into administrative units at the regional level. In the case of Poland these are provinces (NUTS-2), in the case of Czechia and Slovakia – provinces (kraj), and in the case of Hungary – counties (komitat) (all NUTS- 3). The highest intensity of infections was observed in Czechia (Ústecký kraj). On the opposite side, with a low number of detected infections, we have a dense area covering eastern Hungary (without Hajdú-Bihar komitat) and two neighboring countries in Slovakia (Nitriansky kraj and Banskobystrický kraj). In all four capitals, the intensity of infections remains high. This is it: 6,394 (Prague), 3,045 (Budapest), 2,375 (Bratislava) and 2,127 (Warsaw). Also in the largest industrialized area of the Visegrad Group including the Moravian-Silesian province in Czechia and the Silesian voivodship in Poland, a very high number of infections was recorded (5,082 and 4,688 respectively).
This chapter is part of a a book titled: Visegrad Atlas.